Nueral Network
Methodology Overview
Create methods for forward and backward propagation for each layer
Chain each layer together and use the derivatives calculated through backward propagation to optimize the loss function using gradient descent
Implement the network using a linear layer, a ReLU layer, a linear layer, and a loss layer
Code Implimentation
Linear Layer
Forward: Consists of sending the data to the next layer after performing a matrix-matrix multiplication with the Weights matrix (weights matrix starts as a matrix full of random initial values).
Backward: The backward step takes the input of the derivative of the loss function with respect to the linear layer's output, and calculates two derivatives. In this step, we calculate both the derivative of the loss function with respect to X (the layer's input), and the derivative of the loss function with respect to W (the weights of the input) These values can be discovered through matrix-matrix multiplication.
ReLU Layer
Forward: The ReLU forward function takes input X, and outputs a matrix Y of the same size. It permutates through each element of X, and sets that element in Y equal to zero if it the element in X is less than zero, and sets the element in Y equal to the value of the element in X if the element in X is greater than zero. We implemented this methodology by flattening matrix X, and running each element through a lambda function before inputting it into Y. The lambda function returns the max of zero or X (whichever value is larger). We then reshape Y so that it is equal to the shape of the input X. In order to do so, we had to store the initial shape of X. Additionally, we store the input value of X for backwards computations.
Backwards: Our implementation of the backward ReLU computations is based on the fact that we can represent the partial derivative of loss with respect to X, the input of the ReLU function, by using the following formula.

We flatten the input matrix X and run each element through a lambda function that utilizes max(0, x) to set the value equal to zero if the element of X is less than one and equal to its value if the value is greater than zero.
MSE Loss Layer
Forward: To calculate the loss of the function, we first store the difference between the predicted and true output of the linear layer so that we can use that information for backwards computation. This difference is the result of the vector-vector subtraction of the true and predicted values,and the difference is stored as a vector.Next, we calculate and return the mean squared error which is equal to the sum of the each difference stored in the vector calculated in the previous step. We then divide this by the number of samples to calculate the means squared error.
Backwards: for each of the layers predicted values, we compared it to the true value. We took the difference between these two values and used it to solve for the gradient of each predicted value. each gradient values was saved into the same matrix and then returned by the function
Download Project Code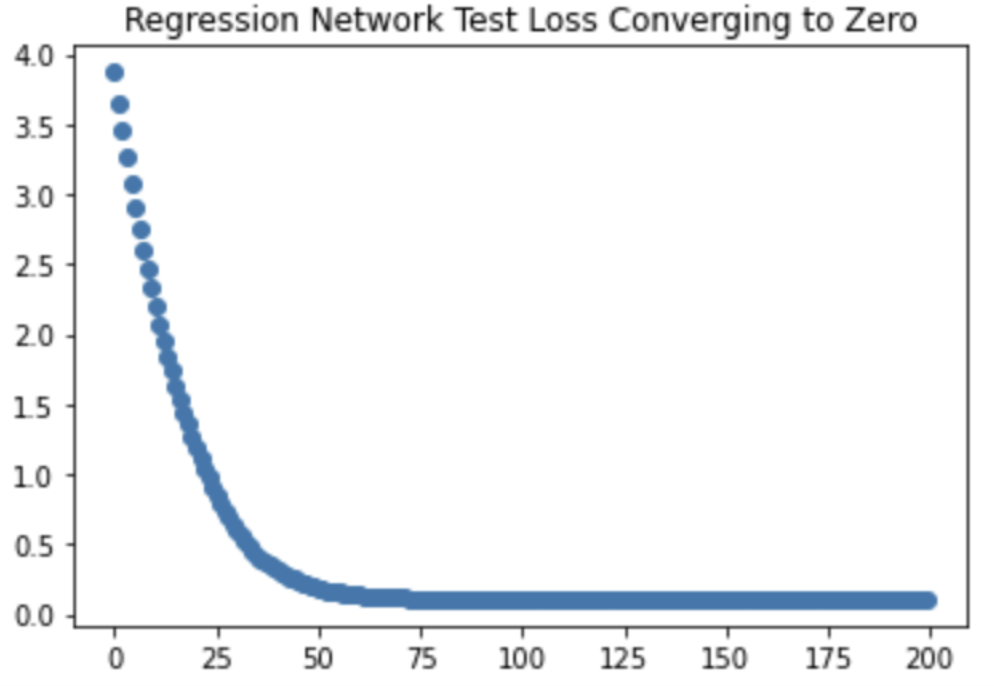
The graph above shows that our network can be effectively trained. The graph shows our loss, representative of the average discrepancy between predicted and expected values, decreasing as more of the training data was fed through the network.
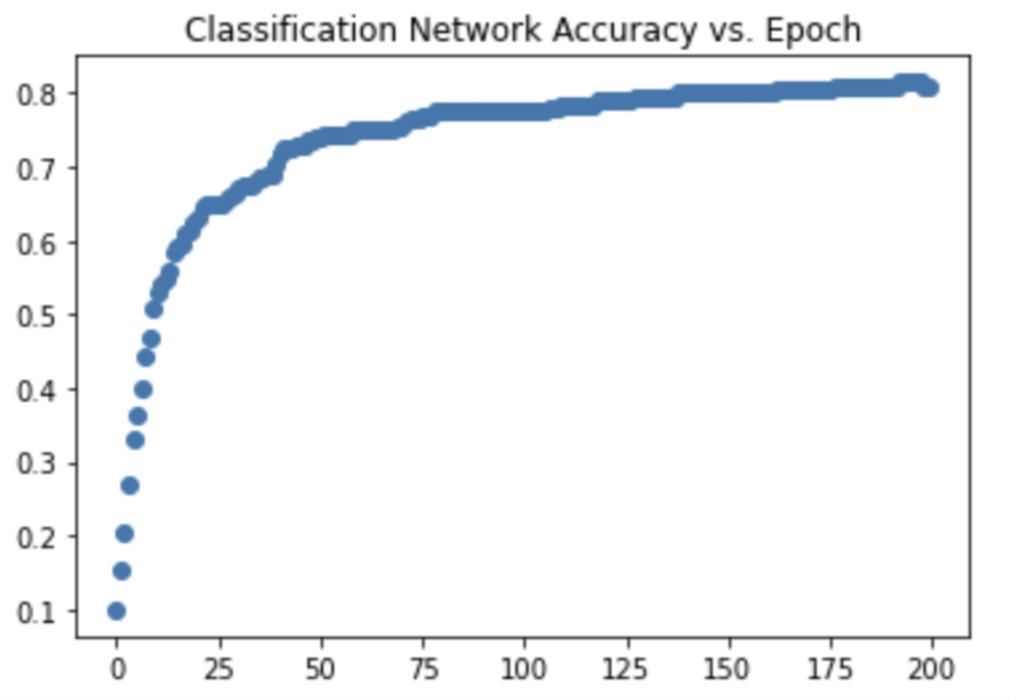
Shows accuracy of neural networks classifications increasing in positive relation to training
Poison Blending
This program seamlessly blends an object or texture from a source image into a target image. I implimented the function Least_Squares_2D which takes in an object photo and backround photo and returns a new image which is the object photo blended into the backround photo. In this program I create matricies useing the pixel color values for both the object and backround images, and then use the least squares method to solve for the matrix representation of the blended image.
Download Project CodeCut and Paste

Poison Blending
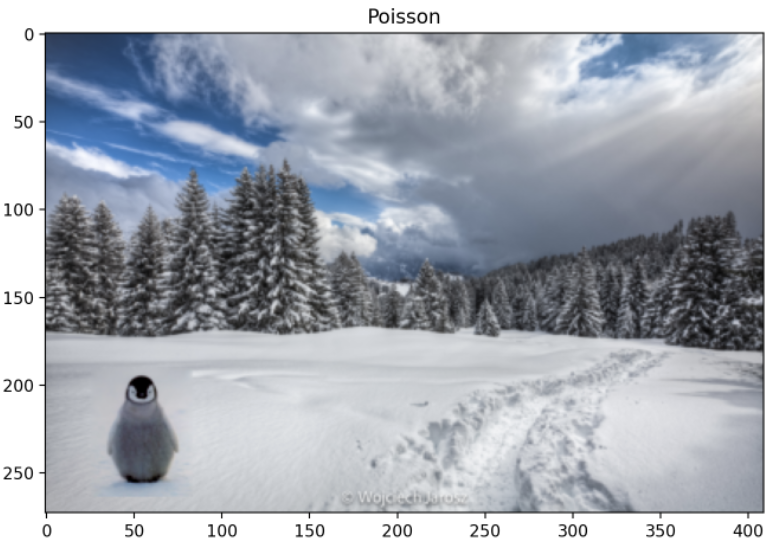
Collaborative Graphical Editor
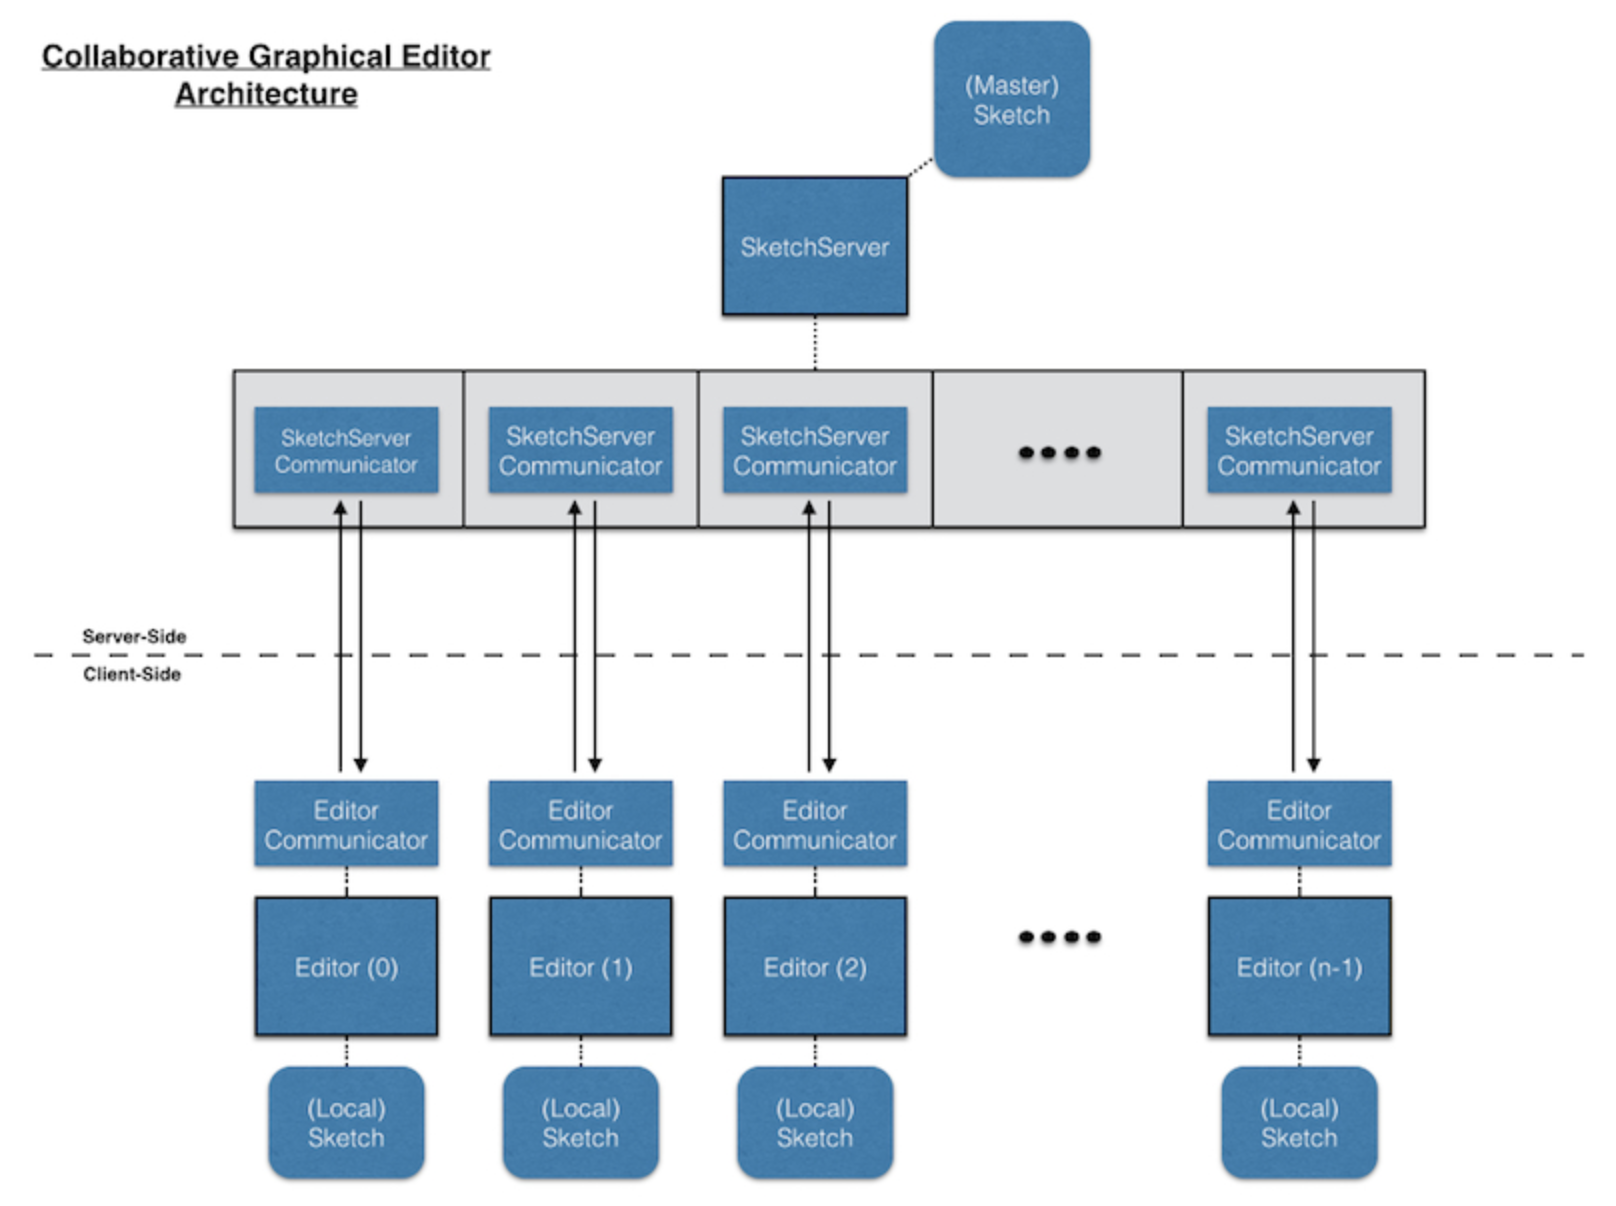
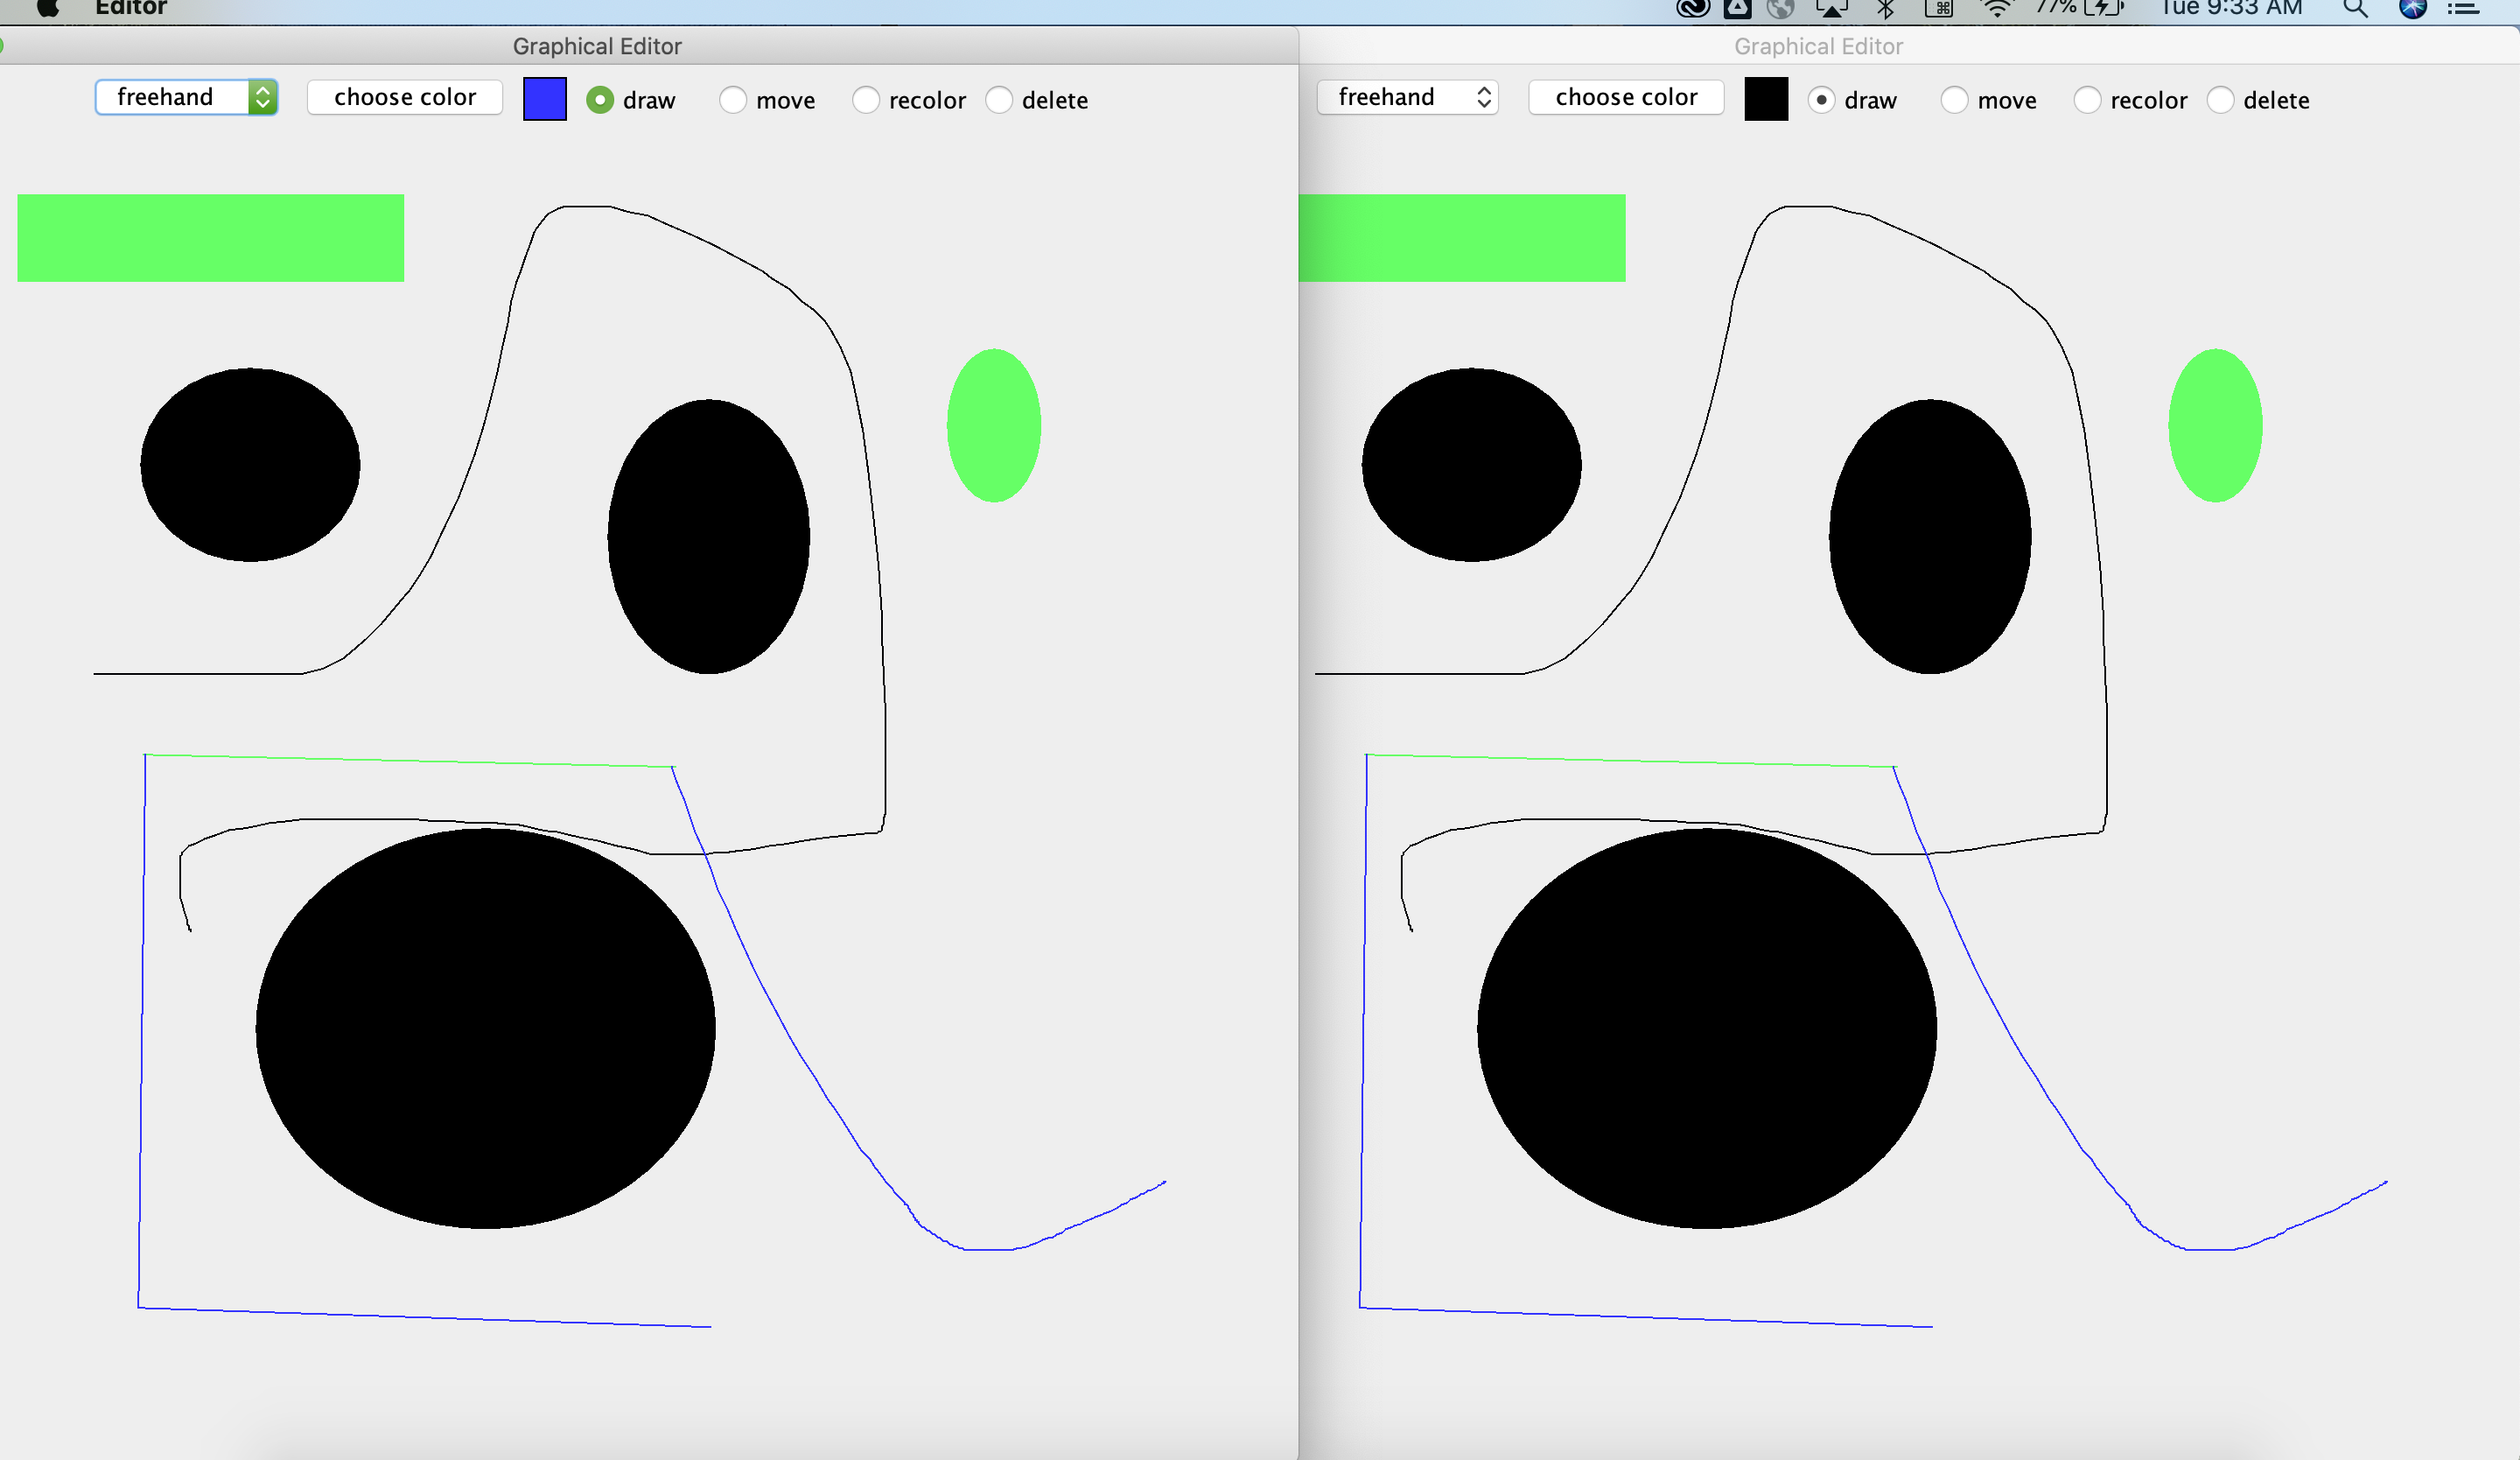
This program allows multiple clients connect to a server, and whatever editing any of them does, the others see. Each client editor has a thread for talking to the sketch server, along with a main thread for user interaction. The server has a main thread to get the incoming requests to join the shared sketch, along with separate threads for communicating with the clients. The client tells the server about its user's drawing actions. The server then tells all the clients about all the drawing actions of each of them.
In order to avopid discrepencies between the graphics display to each editor, a client doesn't just do the drawing actions on its own. Instead, it requests the server for permission to do an action, and the server then tells all the clients (including the requester) to do it. So rather than actually recoloring a shape, the client tells the server "I'd like to color this shape that color", and the server then tells all the clients to do just that. That way, the server has the one unified, consistent global view of the sketch, and keeps all the clients informed.
I completed this project with my friend and classmate Tucker Simpson '24
Download Project CodeSystem Diagram
Side by Side Editor Views
Training A Hidden Markov Model and Traversing it with a Viterbi Algorithm
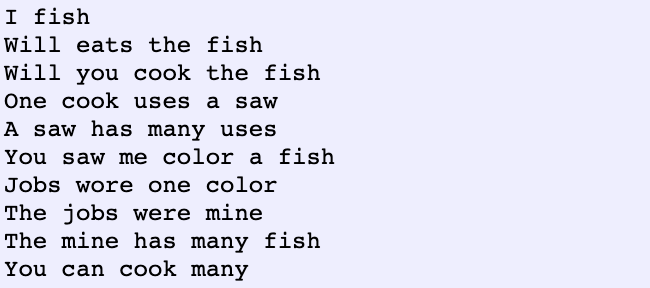
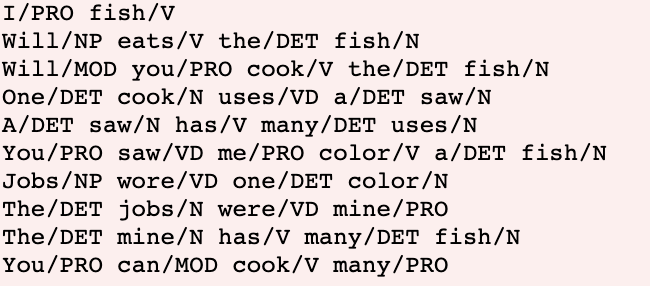
This program reads a sentance from a text file, and predicts the corresponding part of speech for each word in the sentance. The Program uses a Hidden Markov Model. The Hidden Markov Model is trained and based off of example text files. From these example files I extracted the frequency of words appearing as a certiant type of part of speech and the frequency at which parts of speech were followed by another particular part of speech. From this I found reasonable probabilities of a word being a certiant part of speech and the probability that any part of speech is to follow part of speech. The Hidden Markov Model used in this program is structured so that its states are part of speech tags, its transition weights are probability of one tag being followed by the next, and its observations are words with the probability of that word appearing as the states part of speech tags. The image below represents the form of the model.
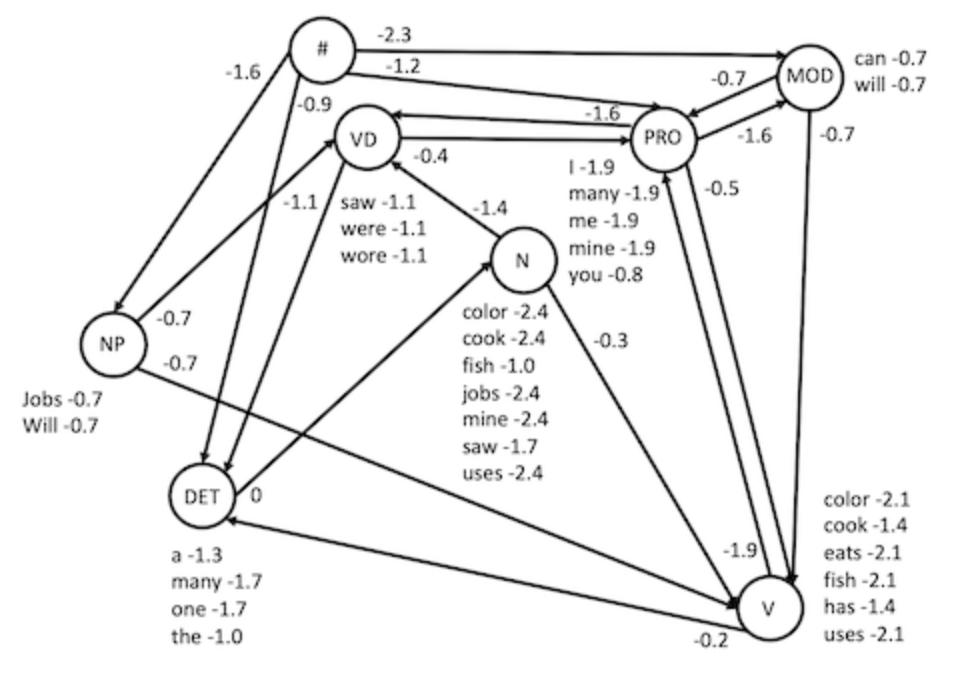
In my viterbi algirithm I traverse the Hidden markov Model and find the highest probability of a part of speech tag for each word in a given sentance.
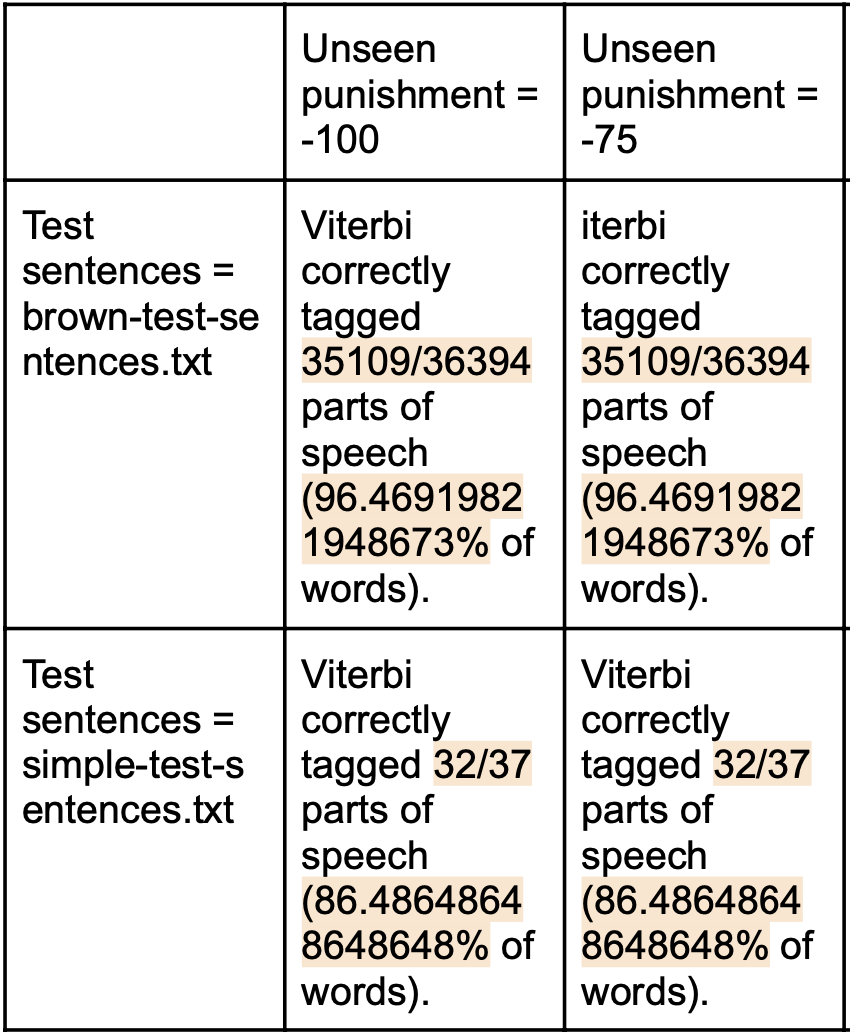
The image above shows the accuracy with which the program labeled the parts of speech of words in given text after being trained with two different different sets of example texts. Unseen punishment is the probability used by the viterbi algorithm to approximate the likelihood that a word it is encountering is being used as a POS that it has never seen it be used as before.
I completed this project with my friend and classmate Tucker Simpson '24
Download Project CodeProgram Input
Program Output
The Famous Bacon Game
Using a breadth first search algorithm to travers graphs I recreated the Bacon game in java. The game allows you input any actors name and get back the number of costars they have in seperateing them from a costar in a movie with Kevin Bacon. For example if the program returns the number 3 the user input an actor who costared with an actor who costared with an actor who costared in a movie with Kevin Bacon
The program begins by reading in and parseing actor data from text files. I use this data to build a graph of which the vertices are the actor names, and the edges are labeled with sets of the movie names in which the two connected actors appeared as costars. So an edge is created when two actors costar, its label is a set of strings, and each movie in which they costar is added to the edge label. The graph comes to look like a much larger version of the graph below.
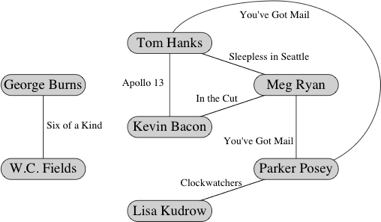
I then used a breadth first search algorithm to build a shortest-path tree (find the shortest path from one actor to kevin bacon) from every actor in the graph that can reach the root (kevin Bacon) back to the root. This reveals each actors shortest chain of co-stars back to Kavin Bacon, and is used to answer the question of what is each user given actor's Kevin Bacon Number
I completed this project with my friend and classmate Tucker Simpson '24
Download Project CodeTerminal Transcript of User Playing the Bacon Game
Make sure to view the game commands at the top of the file
Huffman Encoding
Constructed a tree such that each character that appears in a given file is a node and the path from the root to that character's node gives that character a unique code. The code is created by traversing the tree, where turning to a left child is interpreted as a 0 and to a right child as a 1. In the example tree below the code word for character "e" is 1101.
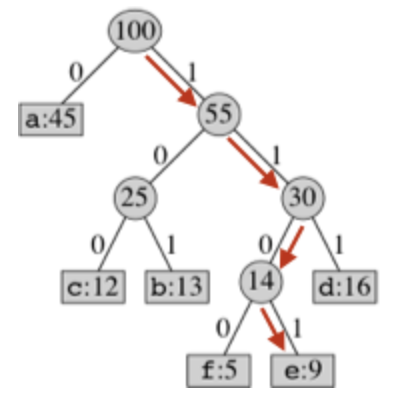
As seen in the leafs above...In creating the tree, the lowest frequency characters must be the deepest nodes in the tree, and hence have the longest bit codes, and the highest frequency characters must be near the top of the tree. This means that long codes appear less in the compressed file taking up less space. To acheive this I read through the text files, an dcounted the frequency of each word. I placed these findings in a map, mapping charcaters to their frequency of occurance. I then place these map items into a priority que and used a custom comparator to return items in order of highest to lowest frequency of occurance. In the order which they where returned by my priority que I inserted these map items into the tree. The entire tree is thus organized based on the frequency at which characters occur, if two charcters have the same parent leaf, their parent is then represented as the sum of both its childrens frequencies.
I used this tree to compress and decrompress files, reading from text files, writing into bit files and then reinterpreting my bits back into the original text.
Download Project CodeUS Constitition Compression and Dcompression
Decompressed File Size: 45,119 bytes
Compressed File Size: 25,337 bytes
Download Compressed VersionPoint Quad Tree GUI and Dot Colllision Detector
This program first creates an interactive graphical representation of a four point quad tree. The data held in each node of the tree is a "blob". Blobs are points selected on the screen by the user. Building the point quad tree of blobs goes as follows. The first blob splits the screen into four quadrants and each blob placed after that creates four new quadrants within whichever quadrant or sub-quadrant it is placed inside. Blobs will be placed in either of the four quadrants created by a previous blob, the quadrant in which a blob is placed corresponds to the child node it will fill of the parent blob. The building proscess of this tree goes as follows:

The second use of this tree structure is when implimenting a Finding Algorithm to efficiently detect all points in the tree whose coordinates fall within a certiant location. I created an algorithm like this to detect colllisions between objects in animation faster and more accurately than binary or linear search time algorithms.
Download Project CodeTree Creation (Insertion)
Blob Collission Detection (Traversal/Search)
Live Cam Paint
This program identifies a user selected "paintbrush" in the users live webcam feed. It then tracks its movements, allowing the user to paint designs in real time across their web cam display. To identify the paintbrush I use a flood fill algorithm. The user selcts a paintbrish by clicking a certiant pixel on their webcam feed. I then deploy the flood fill algorithm to examine all of that selected pixels neighbors, and those neighbors's neighbors ect. I set an adjustable limit of RGB similarity, and based on that limit the algorithm decides weather or not to include a neighboring pixel in the brush stroke, when forming the brush stroke size the flood fill algorithm stops searching once no more neighboring pixels that are simlar enough to the user selcted pixel are found. Below is a basic representation of the process, beginning with the user selecting a one value pixel, all neighboring pixels with a value of one are then identifiied, and then they are all given a uniform new value.
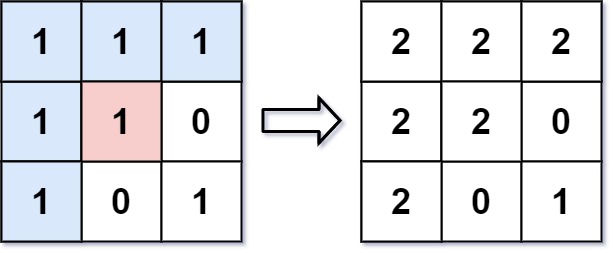
Flood filling is slightly less effective when processing webcam feed. The algorithm produces very different paint stains from frame to frame and requires extremely good lighting to produce consistently shaped regions as an object moves across the screen.
Download Project CodeProgram Output
Using Breadth First Search to Find the Quickest Route to a Destination On Dartmouth's Campus.
This program reads in, parses, and saves information about locations on Dartmouth's campus from text files. Information about each location is stored in an instance of a custom data structure. Each instance holds its own dictionary filled with refferences to the instances of its neighboring locations. I created a Breath First Search Algorithm that traverses this web of interconnected dictionaries, so that when given a starting and end location on campus by the user, the algorithm will compute the path between these two locations that passes by the fewest number of locations (in most scenarios the shortest possible route)
Download Project CodeScreen Recording of Program Output Being Interacted With
Sorting World Cities By Population
In this program I read in data from a csv file containing information about over four thousand cities. I created a custom class that holds city information, and as my program reads in information from the csv file it stores each cities data in an instance of that class. I then implimented my own quick sort function capable of sorting all of the class instances by any of the information that they hold. I visually express my programs abililities by marking cities on a world map in order of population (largest to smallest)
Download Project CodeProgram output marking cities in order of population
Solar System Simulation
In this program I calculated the accelleration of each planet in the solar system based on the forumula:
Accelleration = (gravitational constant)*(mass of affecting planet) / (distance from affecting planet)^2
I applied this forumula to each planet 8 times in order to account for the gravitational pull of each planet in the solar system on its fellow planets. The result is a reasonably accurate computation of each planets accelteration given its position relative to the sun and all other planets. For each total accelleration I calulated, I differentiated the X-axis acceleration from the Y-axis acceleration useing the forumula:
Axis Accelleration = (total acceleration) (axis distance from affecting planet) / (Regular distance from affecting planet)
Knowing these seperate accelerations allowed me to effectivley animate the planets movements.
Download Project CodeProgram output showing the solar system moving at a speed such that 1 second of real time simulates 3 million seconds having passed in the solar system
Pong
This project is the first assignment I submitted to a computer science course at dartmouth. It is a recreation of the famous Atari Pong video game. The game was written in python and leans lightly on a library of simple graphgic user interface functions that were provided by the course to its students.
Download Project CodeProgram output from a game played between my roomate and I
Asteroid Feild
This game was created as part of the introductory segment to Harvard's online cs50 course. The game was made entirely with MIT's Scratch language. All of the games sound effects are recorded by meyself :) Click the green flag to play the game yourself.
